Fan Basics: Air Flow, Static Pressure, and Impedance
Do you know how to use this graph?
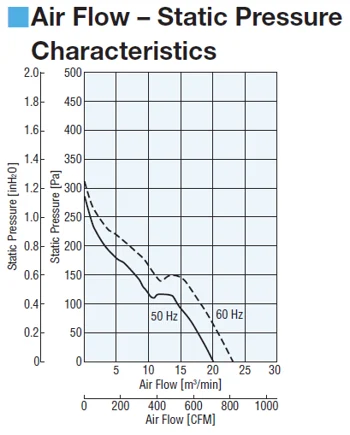
Similar to a motor's speed-torque curve, this graph is how manufacturers show the performance of their fans, and where the air flow and static pressure specifications come from.
For some customers, this may look completely foreign. Many customers I've worked with in the past selected fans based on dimensions and air flow. However, understanding the relationship between airflow and static pressure is essential for determining how the fan will perform in real-world conditions.
In this post, I’ll explain what airflow and static pressure mean, how they relate to each other, and why impedance plays a crucial role in fan performance.
Airflow vs Static Pressure
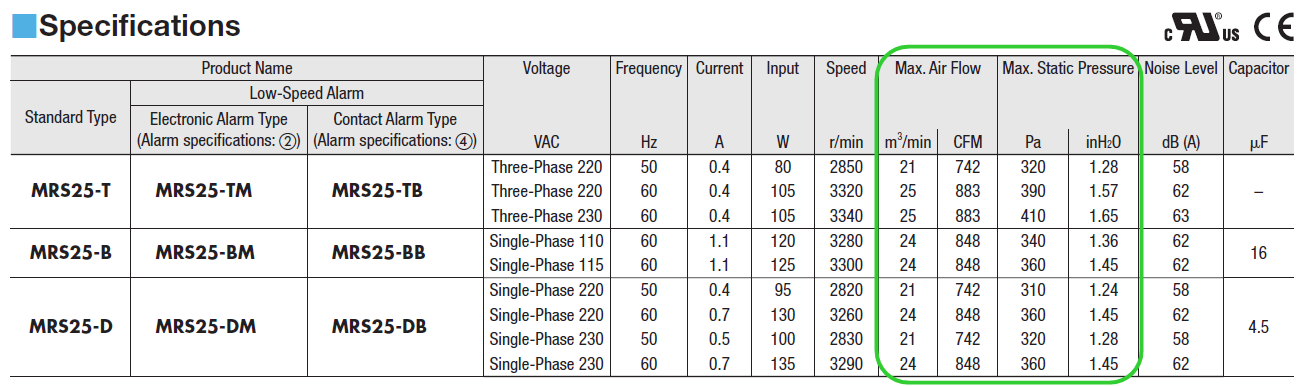
In the fan specifications table, you'll often see "Max. Air Flow" and "Max. Static Pressure." These are key performance indicators, but it's important to understand that they don’t occur at the same time.
Airflow refers to the volume of air a fan can move over a given period. It’s measured in cubic meters per minute (m³/min) or cubic feet per minute (CFM). For example, a fan producing 5 CFM would take about 25 minutes to ventilate a 125 cubic foot enclosure. While this is a simplified example, it gives a sense of how airflow affects cooling efficiency.
Static pressure measures the resistance the fan must overcome to push air through an enclosed space. It’s typically measured in Pascals (Pa) or inches of water column (inH₂O). One inch of water column equals approximately 249 Pa. This measurement helps determine how well a fan can handle obstructions or tight spaces.
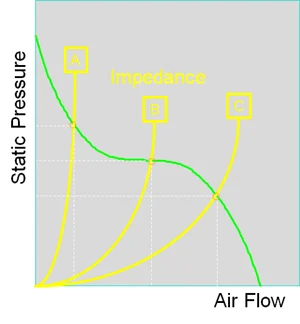
The graph above shows the inverse relationship between airflow and static pressure. As airflow increases, static pressure decreases, and vice versa. Three points on the curve represent different scenarios a fan might face in real applications.
To visualize these, imagine a fan used in an electronics enclosure. In one case, the enclosure is open, allowing maximum airflow with no resistance—this is point 1. In another, there's a small exhaust hole, which creates more resistance and reduces airflow—this is point 2. Finally, if the enclosure is completely sealed, the static pressure rises until airflow stops—this is point 3.
In practice, most applications fall somewhere between these extremes, typically resembling point 2. The double chamber method is commonly used to generate these performance curves.
Â
Installation Density
Now that we’ve covered airflow and static pressure, let’s make it more practical. Electronics enclosures house critical components like PLCs, power supplies, and motion control drivers. These devices generate heat, so proper ventilation is essential. The number of components inside determines the "installation density."
With fewer components (low density), there's more room for air to circulate, resulting in higher airflow. With more components (high density), airflow becomes restricted, increasing static pressure and reducing overall airflow. This is similar to the second scenario in our earlier examples.
Â
The Importance of Impedance
So, how do you determine the actual airflow and static pressure needed? The answer lies in impedance. Impedance is the resistance to airflow caused by components, walls, or any obstruction in the path of the air. It directly influences the fan’s performance.
Impedance is often calculated using the square law, where static pressure changes as a square function of airflow. The formula is:
P = K × Ï Ã— Qn
Where:
- P = Static pressure
- K = Load factor
- Ï = Fluid density
- Q = Airflow
- n = Constant (usually 2 for turbulent systems)
The graph below shows three impedance lines (A, B, and C). The actual airflow and static pressure depend on where the impedance curve intersects the fan’s performance curve. If the impedance is high, the fan will produce less airflow and higher static pressure, and vice versa.
Estimating system impedance can be challenging. A safe approach is to assume that actual airflow will be around half of the fan’s maximum. Therefore, it’s wise to select a fan that can provide double the required airflow.
Other factors, such as the size and placement of intake/exhaust holes, also impact airflow. To better understand this, check out the video below, which uses smoke to demonstrate how different enclosure designs affect airflow.
Â
Â
Accessories like filters, screens, or finger guards can improve fan reliability in harsh environments but also increase impedance, reducing airflow and static pressure. The graphs below illustrate this effect for a 119 mm fan.
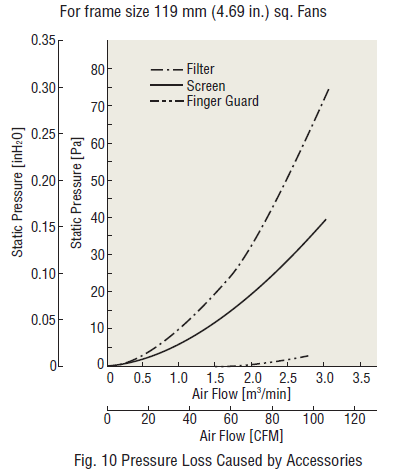
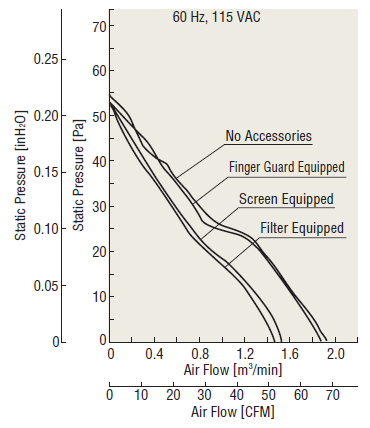
Filters cause the most significant pressure loss, while finger guards have minimal impact. This means that when selecting a fan, you should account for any additional resistance introduced by accessories.
If you want to learn more about cooling fans and their applications, check out our downloadable whitepaper. It covers topics like fan structure, airflow and static pressure characteristics, and how to choose the right fan for your application.
 hbspt.cta._relativeUrls=true;hbspt.cta.load(2284573, '6cb4d806-2dc1-41dd-98df-1b6ae9c2ef6e', {"useNewLoader":"true","region":"na1"});
To learn more about fans, please refer to our white papers.
Topics include:
- Cooling Fan Structure, Airflow and Static Pressure Characteristics, and Heat Protection
- How to Select a Cooling Fan
- IP Ratings – Degree of Protection
Polydadmac 40% Cas 26062-79-3,Water Treatment Polydadmac,Dadmac/Dmdaac 60% 65%,Factory Cationic Monomer
ZHEJIANG XINHAITIAN BIO-TECHNOLOGY CO.,LTD. , https://www.dadmacxht.com